
Adam Spannbauer
Data Scientist/Instructor・Mostly write Python & R for pay・Mostly write p5js for fun・Check me out @thespanningset on Instagram
Plotting Christmas Carols in R
Published Dec 24, 2017
In this post we’ll be playing with spacyr & visNetwork to parse and plot the lyrics of the Christmas Carol ‘Santa Claus is Coming to Town’.
The spacyr package is a wrapper around the spaCy python module for NLP. The parsing capabilities of spaCy are pretty advanced and they allow us to easily get dependency relationships between the tokens in our documents. One way to view the output of these parsing capabilities is to try them out interactively with displacy. Instead of using displacy, we’ll make our own viz using visNetwork.
Before we can perform the analysis we’ll need some text data. Tis the season, so we’ll scrape the lyrics of the carol ‘Santa Claus is Coming to Town’. In the below chunk we scrape the lyrics to the carol.
#load all the packages used in this analysis
library(spacyr)
library(visNetwork)
library(xml2)
library(rvest)
library(data.table)

#scrape 'Santa Claus is Coming to Town'
page_html = read_html("http://www.metrolyrics.com/santa-claus-is-coming-to-town-lyrics-christmas-carols.html")
#extract text of story
page_txt  = html_text(html_nodes(page_html, ".verse"))
#clean up white space
page_txt = gsub("\\s+", " ", page_txt)
Now that we have all of the lyrics we can move onto parsing the text with spacyr. Once we have our environment set up this parse step is a pretty simple task that is accomplished with 2 lines of code in the below chunk. The rest of the code in the chunk does some cleaning up around the parsed pronouns and punctuation.
Note: spacyr sits on top of python & spacy; so you’ll have to have those 2 set up before spacyr will work
#start background py process with spacy en model loaded
spacyr::spacy_initialize()

#perform spacy parse (returns df)
dt_spacy_parse = spacyr::spacy_parse(page_txt, tag = TRUE,dependency = TRUE)
#convert to datatable
data.table::setDT(dt_spacy_parse)
#replace pronoun lemmas with the token
dt_spacy_parse[lemma == "-PRON-", lemma := tolower(token)]
#remove punctuation
dt_spacy_parse = dt_spacy_parse[pos != "PUNCT",]
Plotting a Single Sentence
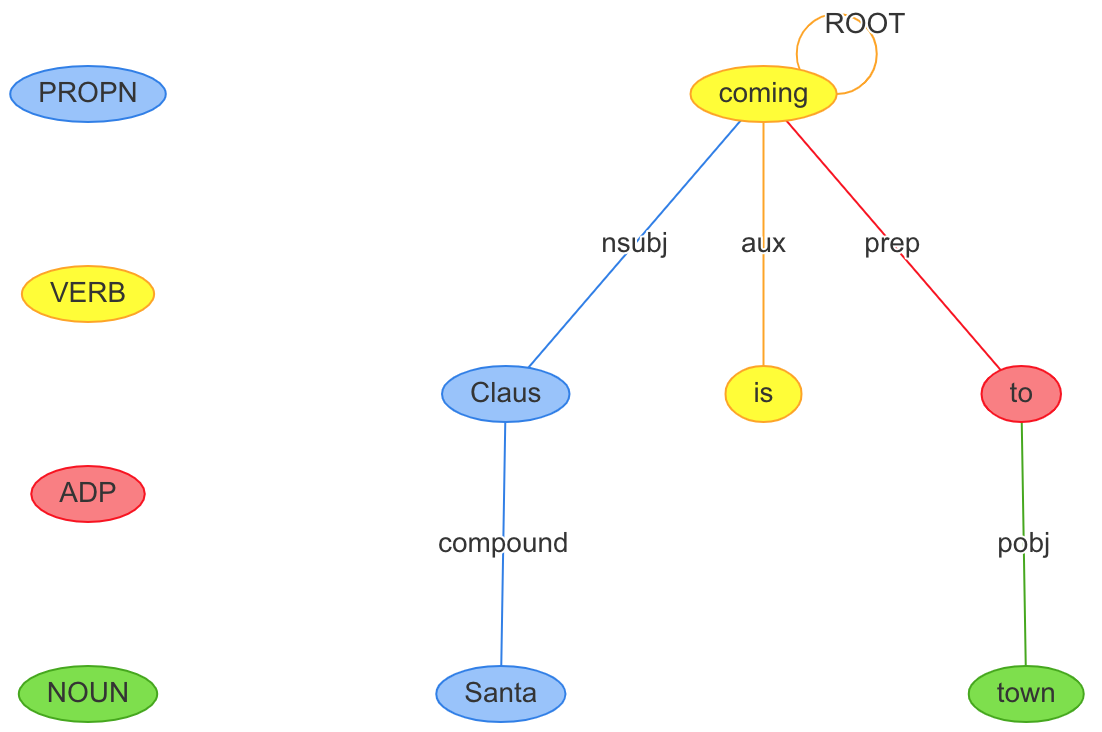
With the parsed lyrics we can move on to plotting the carol’s structure using visNetwork. Let’s start by plotting a single sentence. We’ll use the title lyric of the song as our sentence of interest.
In the code chunk below we use a custom function, prep_nodes_and_edges, to convert the spacyr parse output into the nodes & edges data.frames that we need to plot with visNetwork. This function’s definition can be seen at the bottom of this post. After calling the custom prep function, all that’s left is to do the plotting, and inspect our output.
Plotting sentences like this or using displacy can help give insight into how a particular parser is working.
#select sentence to plot (selected "Santa Claus is coming to town")
sentence_i = dt_spacy_parse[doc_id=="text2" & sentence_id==3]
#re combine words into sentence for plot title
sentence_full = paste(sentence_i[,token], collapse=" ")

#process spacy parse output for plotting with visNetwork
plot_data = prep_nodes_and_edges(sentence_i, label="token")
nodes = plot_data$nodes
edges = plot_data$edges

#plot sentence in heirarchical layout
visNetwork(nodes, edges, main = sentence_full) %>%
  visNodes(shape="ellipse") %>%
  visInteraction(dragNodes = FALSE,
                 dragView = FALSE,
                 zoomView = FALSE) %>%
  visHierarchicalLayout() %>%
  visLegend(zoom = FALSE)
Plotting the Full Document
Using our custom prep_nodes_and_edges function, it’s a small jump to go from plotting single sentences to plotting a full document or corpus. To do this we’ll just leave out the step of filtering down to a single sentence.
Another difference is that we won’t use the hierarchical layout provided by visNetwork so we’ll get a more randomized structure in our viz. (In just a little bit we’ll color it to make it look more like a snowflake).
This viz by itself adds little insight. We can key in on our largest nodes to see which words are most common, but it’s hard to see structure in this viz. A possible way to gain more insight would be push our parse results into a graph database like Neo4j and use a query language like cypher to try and get to more meaningful output.
#process spacy parse output for plotting with visNetwork
plot_data = prep_nodes_and_edges(dt_spacy_parse, label="lemma")
nodes = plot_data$nodes
edges = plot_data$edges
edges = edges[from != to]

#plot whole document
visNetwork(nodes, edges) %>%
  visIgraphLayout()
If we want our carol graph to look more like a snowflake we can add a color column to our nodes data.frame & re-plot.
nodes[, color := "lightblue"]

#plot whole document
visNetwork(nodes, edges) %>%
  visIgraphLayout()
Happy Holidays!
Helper functions for preparing parse data for plotting
#function to get mode of vector
stat_mode = function(x) {
  ux = unique(x)
  ux[which.max(tabulate(match(x, ux)))]
}

#function to prep nodes and edges dataframes
prep_nodes_and_edges = function(parse_df, label="lemma", size_scale=5,minimize_stopwords=TRUE) {
  dt_spacy_parse = data.table(parse_df)
  #create nodes df in format preffered by visNetwork
  nodes = dt_spacy_parse[,c(label, "pos"), with=FALSE]
  nodes = nodes[, .(mode_pos = stat_mode(pos),
                    N = .N), by=label]
  nodes[, id := 1:.N]
  setnames(nodes, c("label","group","size","id"))
  setcolorder(nodes, c("id","label","group","size"))

  if (minimize_stopwords) {
      # set stopwords to size 1
    nodes[label %in% tm::stopwords('SMART'), size := 1]
  }

  nodes[,size := size*size_scale]

  #create edges df in format preffered by visNetwork
  edges = dt_spacy_parse[,c("doc_id", "sentence_id", "token_id", label, "head_token_id", "dep_rel"), with=FALSE]
  edges = merge(edges, edges,
                by.x=c("doc_id", "sentence_id","head_token_id"),
                by.y=c("doc_id", "sentence_id","token_id"))
  edges = edges[,c(paste(label, c("x","y"),sep="."), "dep_rel.x"), with=FALSE]
  data.table::setnames(edges, names(edges), c("from","to", "label"))

  #join in ids from nodes df
  edges = merge(edges, nodes[,.(id, label)], by.x="from", by.y="label")
  edges[,from := id]
  edges[,id := NULL]
  edges = merge(edges, nodes[,.(id, label)], by.x="to", by.y="label")
  edges[,to := id]
  edges[,id := NULL]

  list(nodes=nodes, edges=edges)
}